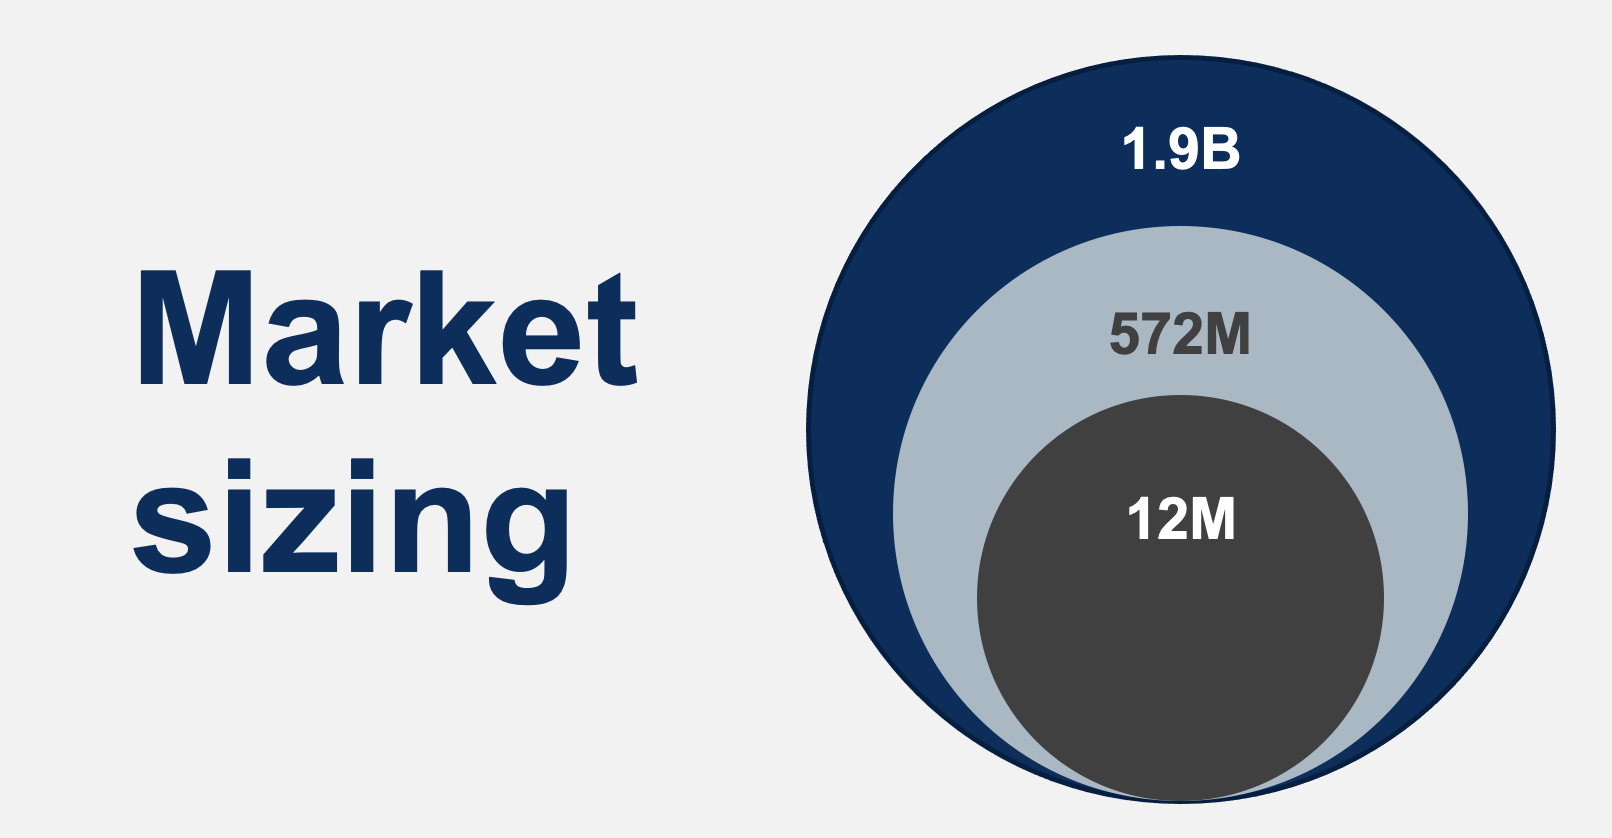
A brief exploration of market sizing approaches
Market sizing is a vital part of many SATOV engagements. Arriving at an accurate market size allows our clients to make informed investment decisions, determine their market share in an industry, and better evaluate adjacencies. Market sizing isn’t always easy though, which is good news for our business, but not always for our analysts! We are regularly asked to evaluate niche or data-limited industries, requiring us to take creative approaches to arrive at a suitable and accurate market size.
Broadly speaking, there are four research streams we use to calculate our market sizes:
- Online secondary research (e.g., research reports, investor decks, articles)
- Primary research on target populations (e.g., surveys or interviews)
- Internal client data and research
- Expert interviews
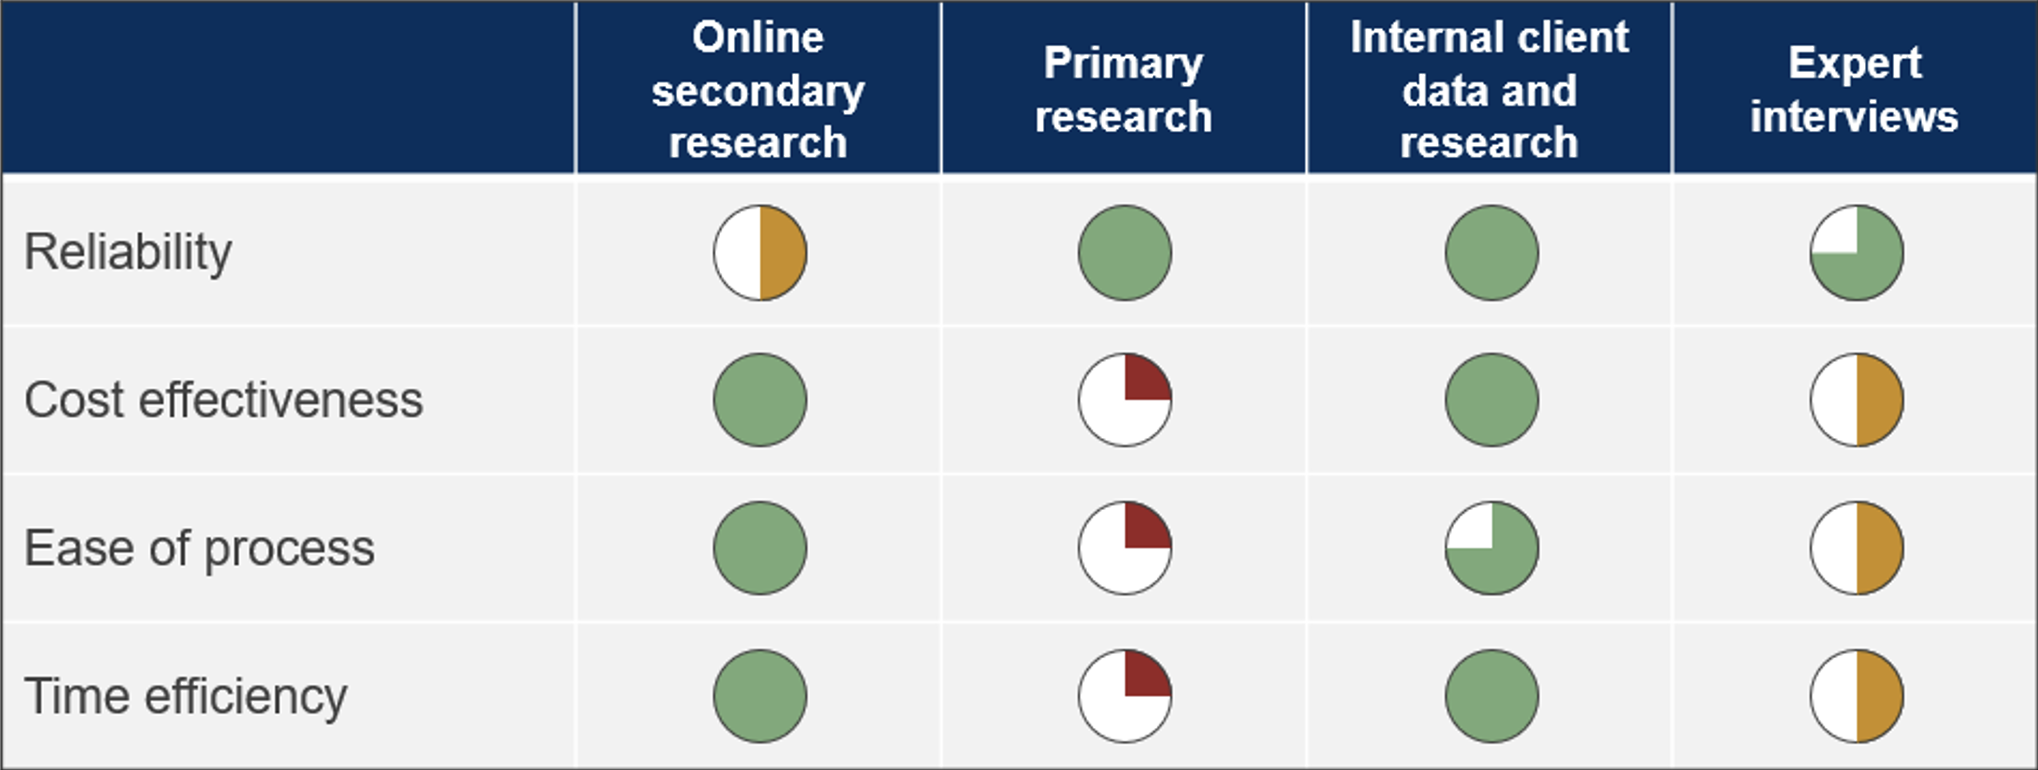
Although these four options are all in our toolkit, it is often not feasible to use all of them on an engagement. It is important to consider the benefits and trade-offs of using each before deciding on our approach (see Image 1). The combination of sources differs case by case. Below we outline three sanitized client engagements showcasing different market sizing approaches.
Image 1. Research source comparisons
Many different data sources exist for market sizing; however, each comes with trade-offs. It is often not feasible to use all of them.
Case one: Infrastructure in healthcare settings
A client tasked us with evaluating spend over the next ten years on the installation of a certain product in the healthcare space.
The specific product we were evaluating was a minor part of healthcare’s overall spend on hospital infrastructure, so minimal online research existed on sizing the market for the installation of these products. To arrive at a market size, we would need to sum the estimated project cost of installing the hardware in each individual hospital.
Determining the project price formula
- We first spoke to our client and experts to understand how project cost is determined. We found that cost scales with hospital square footage.
- Due to the commoditized nature of our target product, we assumed that pricing would be consistent between our client and competitors (an assumption we validated via expert networks).
- To arrive at an average price per sq./ft. for product install, we used the client’s database of past projects, and compared that data with the hospital’s sq./ft. where the information was available.
Discovering total floor space required
- Data on sq./ft. for most hospitals in Canada is not easily accessible, so we needed to use a proxy for floor space. Luckily, the Canadian Institute for Health Information has each hospital in Canada listed with its number of beds, so we selected the number of beds as our proxy.
- Healthcare research articles pointed us towards a recommended average sq./ft. per bed in a hospital setting, which we then multiplied across the number of beds in each hospital to get estimated floor space.
Considering project price adjustments
- Due to the physical labour required for the installation, there is a minimum project price regardless of the size of the hospital. And at large floor areas, there are scale efficiencies that create an upper bound on pricing. We spoke to the client’s executive team to determine the minimum and maximum project cost (e.g., all hospitals under 50 beds would be the same project cost, and similarly all hospitals over 1,000 beds would be the same cost).
- It’s important to consider that redevelopments are easier to work for the installers than renovations, so a cost premium was applied to the percentage of hospitals that would be renovated versus fully redeveloped (estimated from government budget documents).
Aggregating final market size
- We asked experts for their view on the minimum hospital size that would be logical for these products to be installed in to create a range of opportunity sizes from most to least realistic.
- Ultimately, the full project cost equation was applied to each hospital individually, and then the project costs were summed to arrive at the final market size.
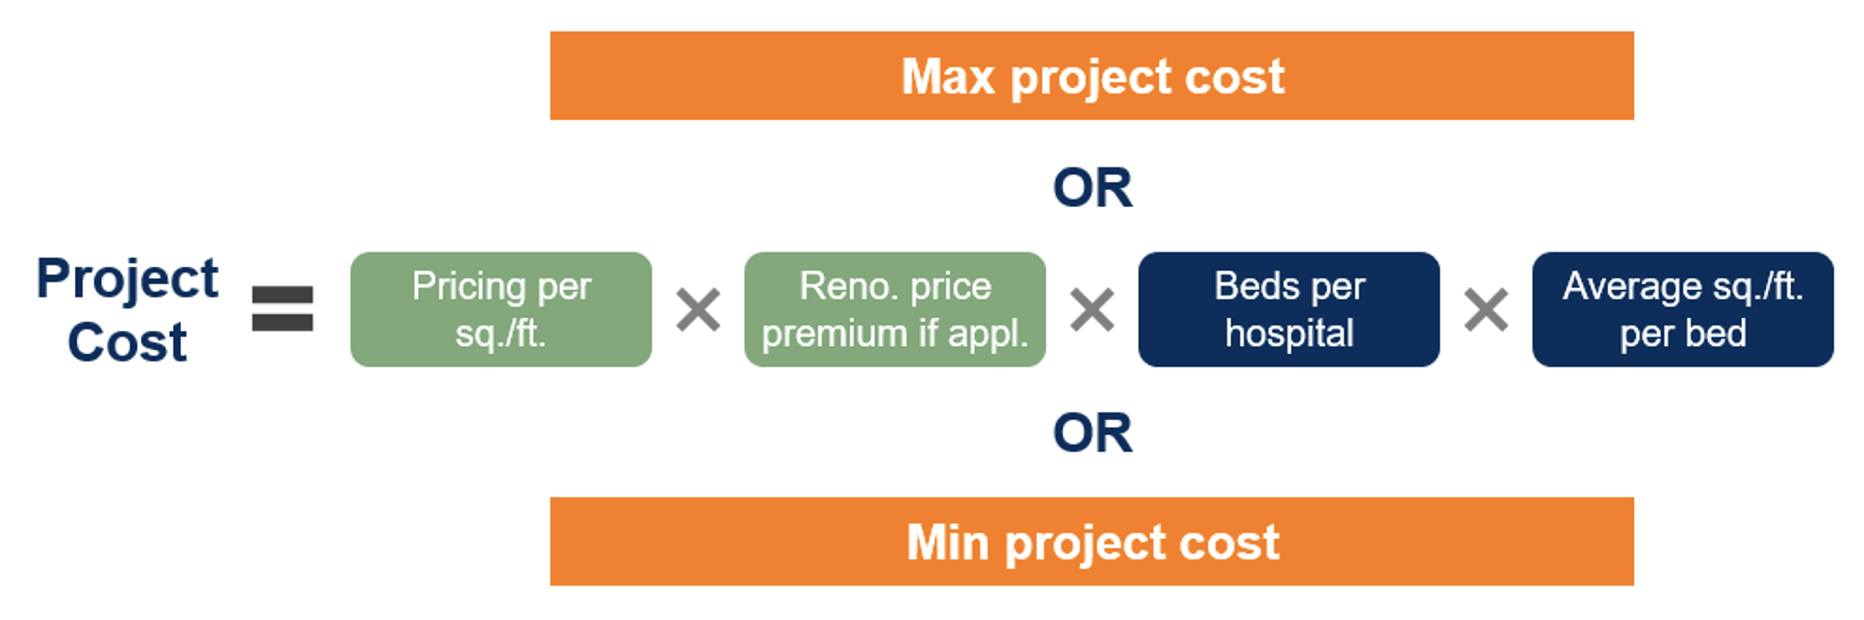
Image 2. Project cost formula for hospital product installations
Finding the market size for the industry at large involved calculating the potential project size for each individual hospital.
Case two: Lending in Canada
A client on a commercial diligence engagement tasked us with determining the annual dollar value for originations (total amount of debt borrowing approved by lenders) for a lending product in Canada.
The product is only offered to certain demographics in Canada. Information on demographics is plentiful from StatsCan; however, the target’s financial decision-making process and their openness to borrowing was not well researched in Canada.
To solve for the lack of financial decision-making data, we built and launched a survey to a sample of over 1,000 people across all of Canada. We could then combine the likelihood to borrow with the demographic data to arrive at the total origination dollar amount.
Modelling population growth
- Using StatsCan population forecasts, we built a population model segmented by geography for Canada.
Estimating asset price appreciation
- Using past Canadian average asset values, as well as inflation and index forecasts, we created scenarios to help us predict how much the dollar value of required borrowing would increase over the next ten years.
Discovering likelihood to borrow
- The results from our survey allowed us to categorize our target demographics into segments based on how likely they were to require lending and how much money they would be looking for.
- By asking survey respondents questions around their shift in likelihood to borrow if they received additional education on the lending product, we were also able to create scenarios that modelled additional originations with increased marketing spend by the client.
Determining overall originations
- We then applied the proportional breakdown of the segments discovered from our survey to the overall population model in Canada and applied their likelihood to borrow with the estimated asset price appreciation to arrive at a total dollar value of originations.
Image 3. Segmentation of lending product survey respondents
Segmenting the respondents in a survey provides you with “likelihood to purchase” proportions that you can apply to the larger population.
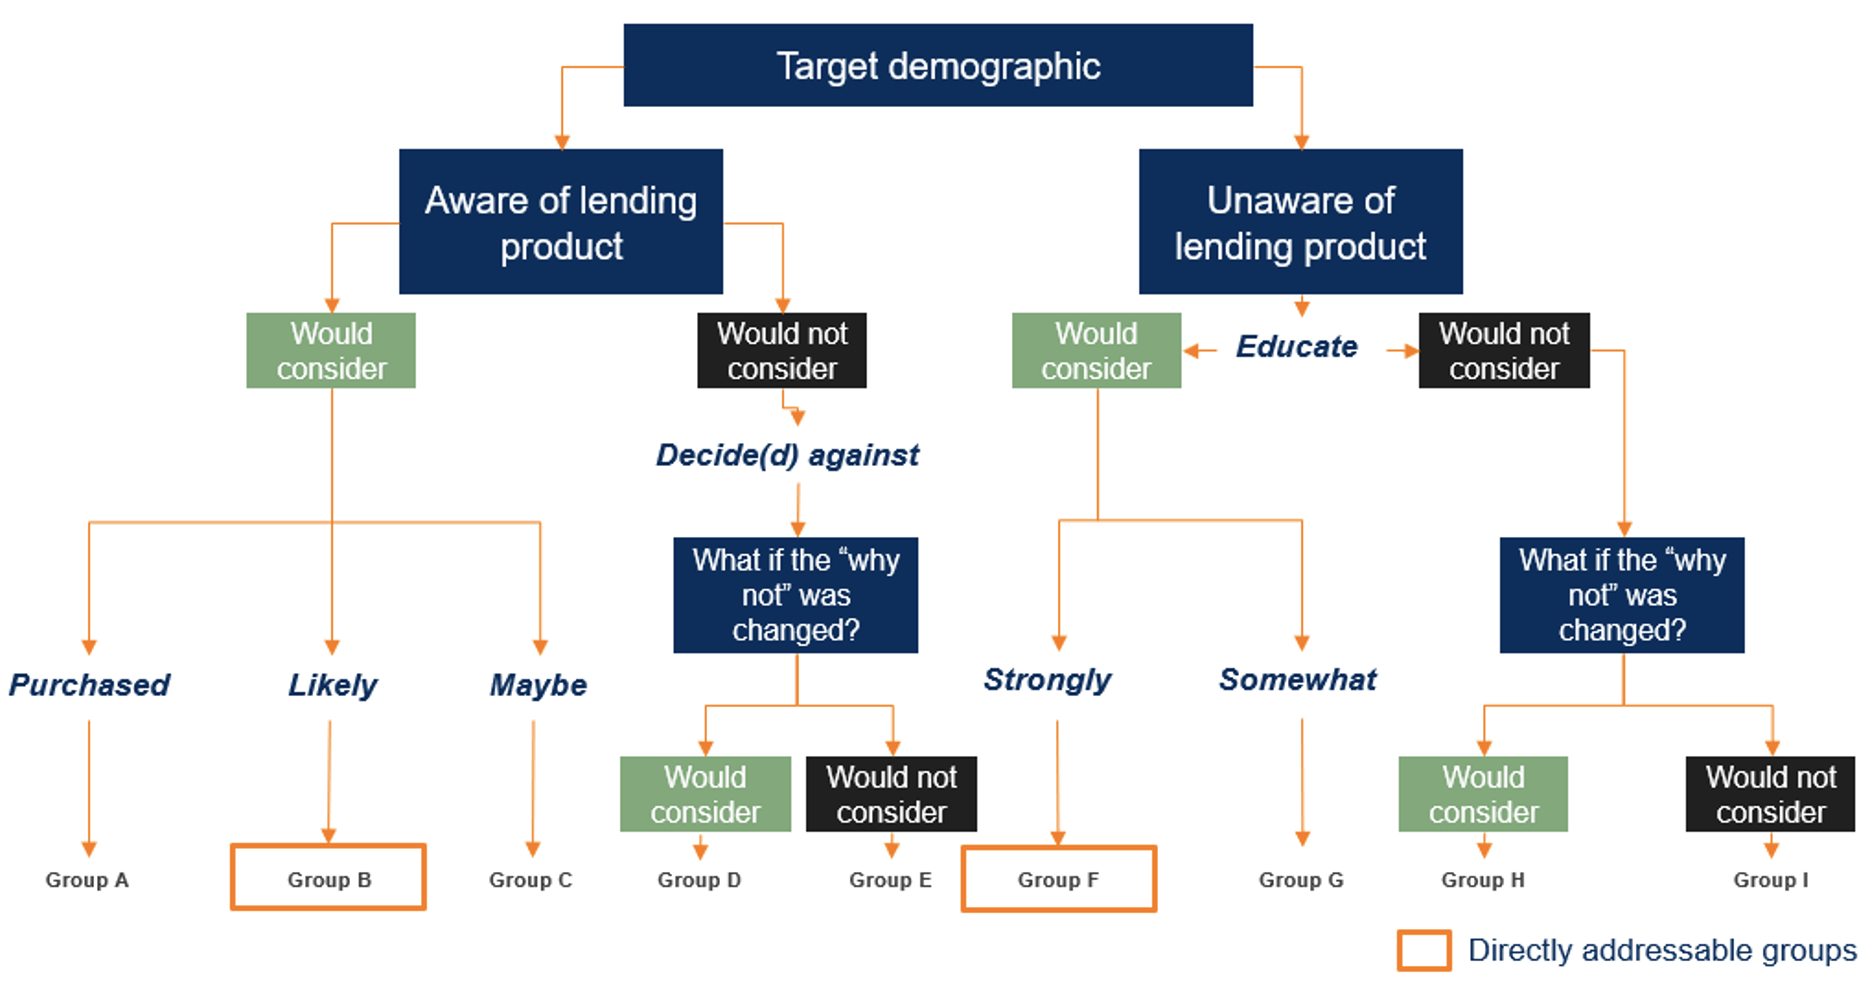
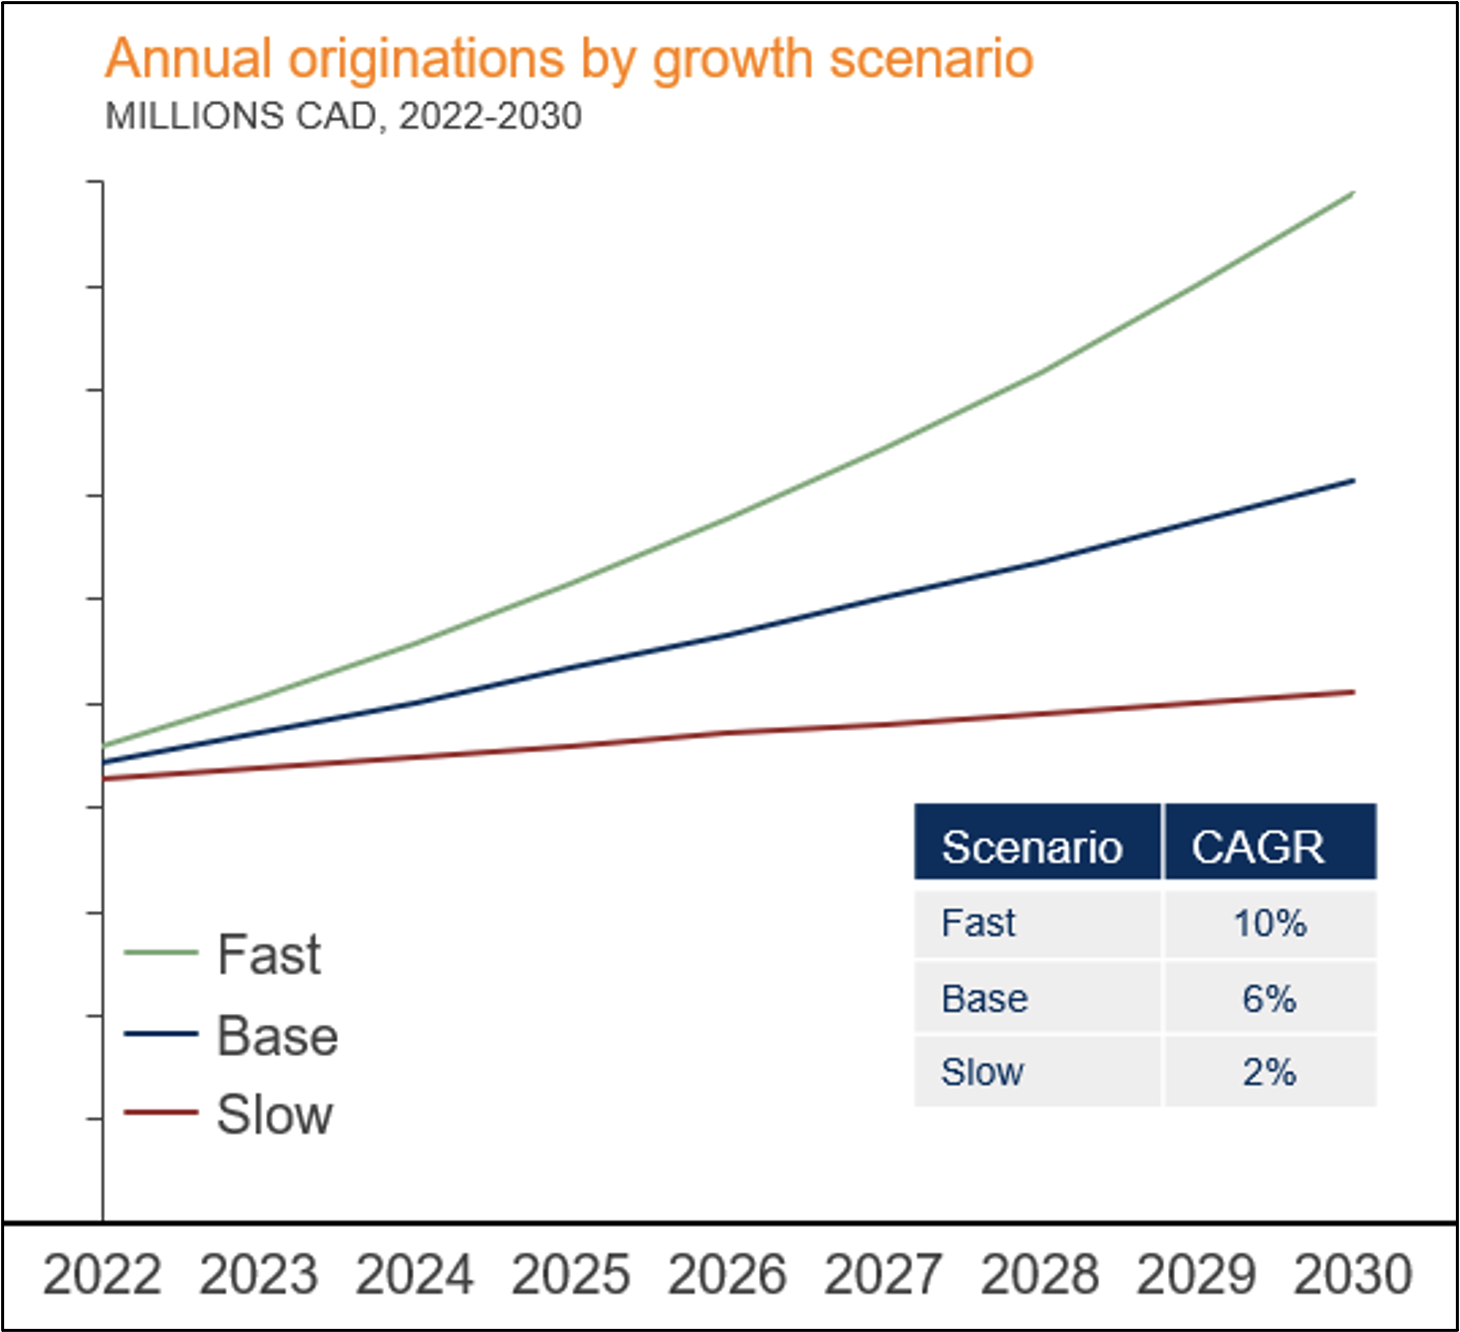
Image 4. Origination estimates for a lending product
Presenting sensitivity cases to clients is important. Predicting the exact future is impossible, so showcasing multiple outcomes allows clients to assess investment risk more accurately.
Case three: Residential services
One of our clients, a residential services company with many locations across the US, was looking to maximize revenue captured throughout their sales funnel. They tasked us with increasing conversion at every step in the funnel: accepting calls, booking calls, attending calls, quoting a sale, and then closing on quotes.
We were lucky that our team was given significant ticket data for each location, which allowed us to view individual location conversion at each step in the funnel.
Although this was sizing an improvement opportunity rather than market sizing explicitly, similar principles and steps could be applied.
Building the model
- We built a model in which each location had its funnel ratios connected, so that we could adjust any location’s conversion at each step and then view how changes would flow through to the final sales number.
- The model was pre-populated with the client’s 2021 year-end numbers.
Implementing growth levers
- We needed to account for the question of “How much can you grow each location realistically?” (i.e., Transferring best practices from a good location to a weaker location will only improve the weaker location.)
- The resulting model had three core levers which could be adjusted to create growth scenarios:
- Increase each centre by a proportional percentage (e.g., bring call taking up by 5%)
- Bring all the below-average locations to the company-wide medians or means
- Bring all the below-average locations to their regional medians or means to account for the significant geographic differences in the US
The model not only allowed us to view the total opportunity, it also allowed us to have a more targeted approach to the rest of the case. For instance, it showed us which areas of the funnel offered the largest improvement, so we focused on hypothesizing solutions in these conversion steps. The model highlighted which were the right locations (best performing and largest opportunity to improve) to visit for evaluating best practices. Lastly, having concrete data narrowed down the questions to ask during internal interviews with our client’s employees.
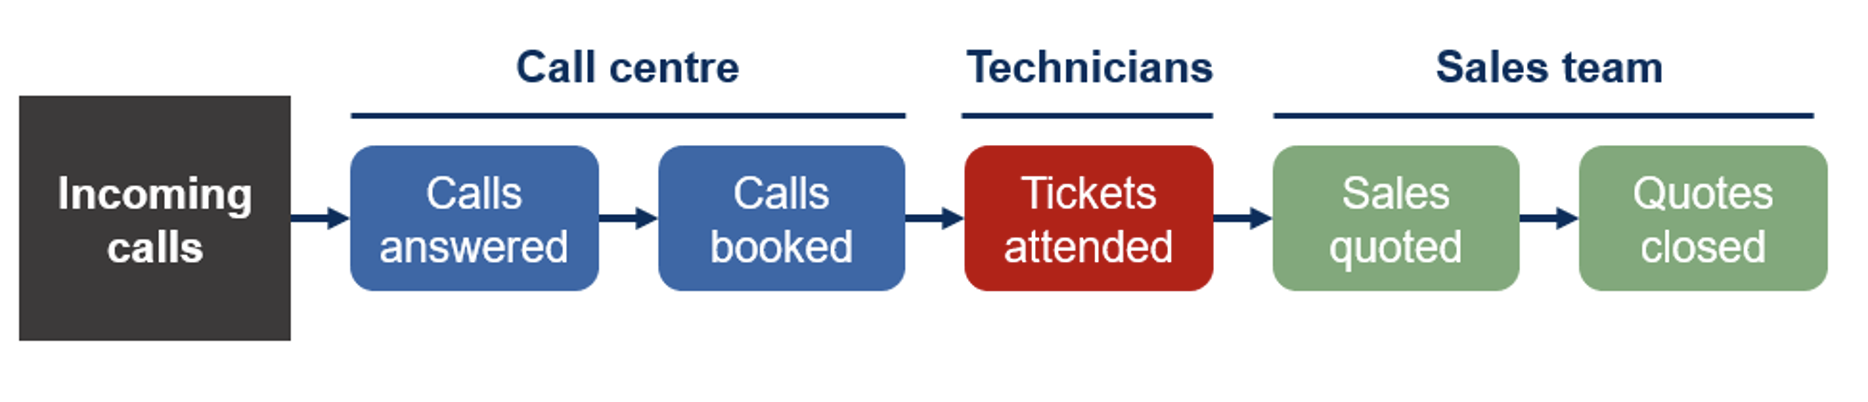
Image 5. Simplified sales funnel for a residential services company
Each of the steps in the funnel provides you with conversion-driving levers to adjust, which culminate in revenue growth.
There truly isn’t a one-size-fits-all approach for opportunity sizing. Although we always prefer using real, quantifiable client data or primary survey data, sometimes you must take creative approaches to supplement secondary research. We aim to tackle all situations in a bespoke manner to ensure clients’ unique questions are answered with actionable insight.